


PWYP-US kicks off data skills training series: Workshop 1 – Data Organization and GIS Basics
Blogs and News


This blog was originally posted on
www.extractafact.org
on June 3, 2016.
On May 19, Publish What You Pay – United States (PWYP-US) hosted the first of two data skills training workshops to explore ways of using the USEITI data with the open source QGIS mapping software. In the first session, our trainer, University of Maryland Geographical Sciences PhD candidate, Diana Parker, introduced the basics of organizing data as well as an introductory understanding of geographic information systems (GIS).
With the growing availability of voluntary disclosures through the Extractive Industries Transparency Initiative (EITI) and mandatory disclosure requirements coming into effect in a number of countries (and soon in the United States) there is an ever expanding pool of natural resource data that is now available. With these trainings, PWYP-US sets out to empower interested actors and provide them the tools to apply this wealth of data to improve governance of the natural resource sector. The United States implementation of EITI ( USEITI) dataset was used in this training as an example of how geographically delineated data can be cleaned, sorted, and mapped.
Attendees were guided through the processes of preparing the USEITI data for use in QGIS, followed by an introductory tutorial of making basic maps. The first step of cleaning and sorting the data is critical to ensure the interoperability with applications like QGIS. Not all datasets are created equal. For example, datasets concerning oil production and revenues from different sources are more than likely presenting the data in slightly different ways. The initial step of any data analysis will often be working with software such as Excel and the use of pivot tables to ensure the data file is prepared in a way that can be interpreted by data analysis and data visualization software. This critical first step of of preparing the data was covered in detail in this introductory training.
Once organized, the data itself can yield some insights, but visualizing the information can be an important next step in raising questions and drawing conclusions from the data. Through visualizations the information can be made more accessible to broader set of stakeholders. There are a number of ways to visualize data that should be familiar to most people who have worked with even the most basic set of financial or budget spreadsheets. There are even some useful shortcuts to creating quick bar graphs and pie charts, such as using the ‘explore’ button in online apps like Google Sheets. Organizing geographically-tagged data and visualizing the information in a map can be a very effective way of gaining a better understanding of the underlying data.
The basic map below (one of the outputs of the first training session) visually depicts which counties across the United States have the highest revenue from natural resource extraction.
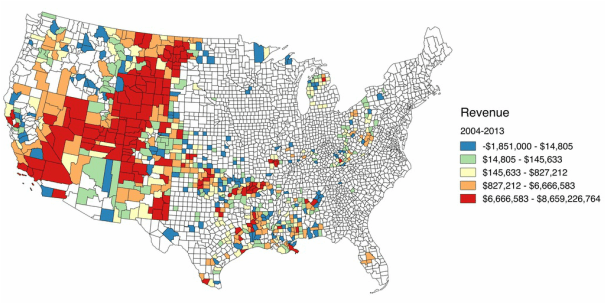
As one example, advocates can draw conclusions from such a map and decide how best to direct their campaigns to assist communities most affected by mining activity.
There is much more that can be done with QGIS using the USEITI data. For those interested in learning more, the next training will be held June 7 and will instruct participants on how to construct more complex maps in QGIS.
Click here to watch the training video and follow this link to download the instruction manual and datasets. Instructions for installing the free QGIS software are also available in the linked Google folder. If you take our course, tell us what you think by filling out our post-course survey.
Extract-A-Fact , a project of Publish What You Pay – United States
, is intended to empower citizens, activists and journalists to take oil, gas, and mining data and use it as a tool to demand accountability from governments and extractive companies. Extract-A-Fact works in partnership with PWYP International’s Data Extractors Program.
Share this content: