


5+ tools every Data Extractor needs to know
Blogs and News


Asking why we need to use data is like asking why we fall in love or breathe. We need to use data for the simple reason that it’s available left, right and centre. As advocates, data scientists, government officials, campaigners, and ordinary citizens, we have the key to making meaningful change happen in our own communities.
However, with tons of extractive industries’ data recently made available, we sometimes find ourselves trapped and lost, not knowing what to do next. We ask ourselves (in front of the mirror, in some cases) questions like: will this data be relevant to the affected communities? What is this data trying to tell me? Where do I find this kind of extractives data? How do I organise my data project ideas?
How do I turn data into impact?
Don’t stress out. We’ve got you covered. So make some tea or coffee, sit down, forget that heartbreak and move forward.

1. Data needs to be relevant to your audience. Otherwise, your audience will take the data for granted or ignore it. When you don’t know what data your communities or audience need, you can use a data user template. It’s a simple and handy tool for your communities to fill out. It asks them what issues matter to them and helps them identify the decision-maker or key stakeholder, and the data they need the most. This makes data you want to work on relevant to your audience and their advocacy. You can download the guide, template, and case study here.
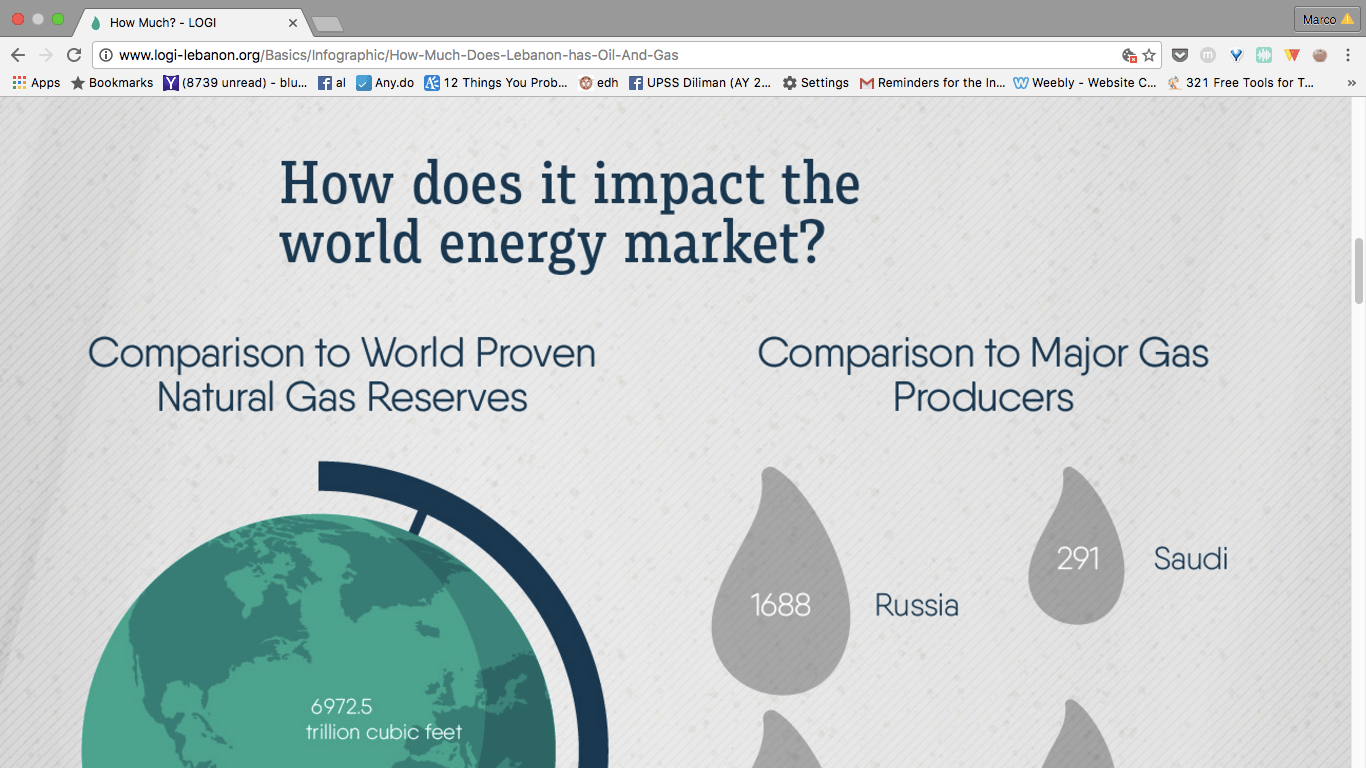
2. Data should be available and open. When you don’t know where to find data, especially extractives data, use one of the many existing open data portals out there. Trust me, there are many fish in the sea. Here’s a shortlist:
– EITI.org – for data disclosed in EITI reports from 49 countries as of 2015.
– World Bank and IMF – where you will find macro-indicators and some extractives data such as trade data, resource rent as a percentage of GDP, etc.
– For country-specific extractives data, you can check open data portals for USA, Lebanon, and Philippines.
3. Data needs to be understood and analysed. When you have loads of data to analyse, you can use Tableau Public. It’s a powerful tool but requires some time to learn. It lets you visually analyse data by dragging and dropping variables such as extractives tax payments, production and so on into a dashboard. This tool allows you to manipulate and play with data but not feelings. Those two are different.
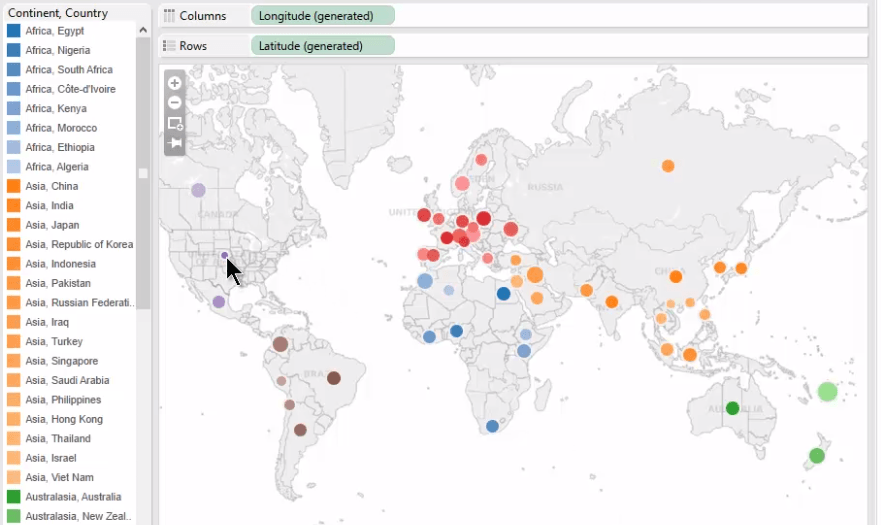
Source: https://www.freakalytics.com
4. Data should leave a lasting impression. When you have data but don’t know how to visualise or present it to your community, use Piktochart. It’s free to use and easy to learn. For tips on how to present data, here’s a blog they wrote. You can find a list of color combinations and a tool for fonts to combine with Canva to make designing hassle-free. Find some inspiration when you feel like making a data visualization here.
5. Data shouldn’t just be numbers. Data should never be taken for granted because it’s there for you, no matter what! When you want to turn your extractives data into impact, use the “Innovation Tool (Modified for Data Projects)”. This tool comes with seven stages and systematises the use of data for projects. The tool first asks you to identify “Opportunities and Challenges” (i.e., release of EITI reports, EU mandatory disclosures) which then sets the direction of your entire data project. In filling out the tool, remember to focus on one stage at a time – I don’t advise working on two or three stages at a time. You can download the guide and template from page 128-129 here and a case study here.
A tool which complements the innovation tool is the “Scaling up Plan (for Data Projects) Tool” in case you want to scale up your project in the future. You can find the guide and template in the same file as the Innovation Tool from page 122-123.
Data shouldn’t be overwhelming. With the right tools, data can work for different needs. I urge you to appreciate your data as if it was the last data left in the world!
Happy data use!
Follow me on Twitter: @zaplanmarco
Check my website: www.marcozaps.com
Email me at: [email protected]
Share this content: